
The amazing unity of science in fractals and power laws and their business applications.
There are two kinds of people in this world, those who don’t know about fractals (and won’t get this joke) and those who think that there are two types of people in this world. If you didn’t get this recursive and twisted joke, you don’t know about fractals, and you’re going to want to read this.
Power Laws, Long Tail Distributions, and Fat Tails
Before we get into what Power Laws mean, it’s worth contrasting power-law distributions with normal distributions and the central limit theorem from probability theory.
Normal Distributions
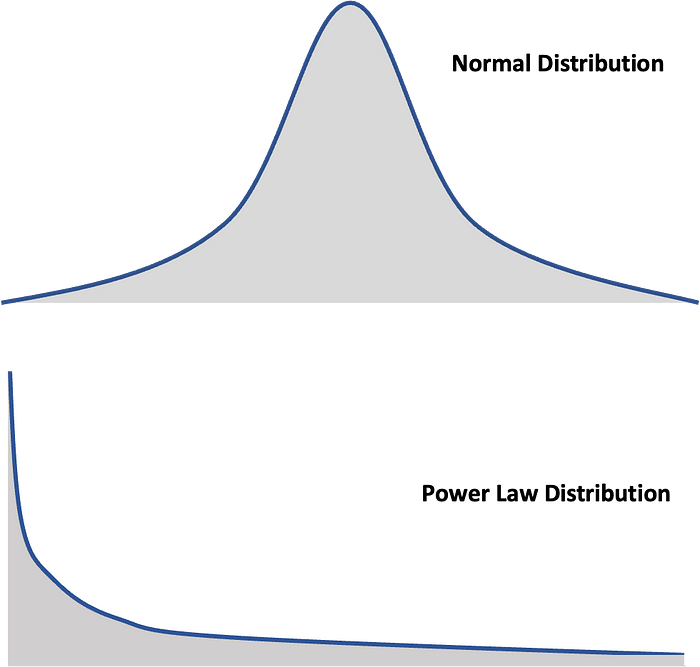
Normal distributions or Gaussian distributions are sometimes referred to as bell curves because they have a shape that resembles a bell. Their shape is based on the central limit theorem, which establishes that, in most situations, when independent random variables are summed up, their properly normalized sum tends toward a normal distribution.
We say “normal” distribution when there’s some kind of mean μ and another kind of standard deviation σ, whenever we take a sufficiently large random sample from a population that leads to a bell-shaped curve. Let me explain that with the example of the distribution of people’s heights.
If we were to plot the distribution of people’s heights, we would find many people around the average height of 5–6 feet. Some will be a bit larger and some a bit smaller, e.g., 3–8 feet, but virtually no one will be outside this range. Normal distributions have a well-defined center and then drop off exponentially fast. It indicated a very low probability of extreme states and that no states will fall outside the range. For example, there will not be a single person with an average height of 10 feet. Now, let’s compare the normal distributions to the power-law distributions.
Power Law Distributions
Power-law distributions differ from normal distributions in terms of the shape of the curve. Power-law distributions have no averages and are said to have long tails that extend indefinitely (also sometimes referred to as heavy-tailed distributions and fat tails), and they decay much slower than exponential distributions. The key feature is that anything that follows a power-law distribution can be unpredictable and cannot converge to some average, as is the case with normal distribution.
As we discussed earlier, extraordinary events are virtually impossible in normal distributions. So, if we go back to our example of people’s heights, and we sample the same population, only this time, we conduct it in a hall with, say, 100 people. Then the tallest person in the world walks into the hall, and the average height will barely change.
But if we conduct a different sampling exercise, and instead of measuring people’s height, we measure people’s income. Now, let’s imagine that the wealthiest person in the world, whose net worth is over $100 billion, walks into the hall. How would this impact the average income? The average income will shoot up by around $1 billion. Considering that the average net worth in the US is around $125,000, then the average net worth in the hall would jump to $1.1 billion.
You can see how the event of the tallest person vs. the wealthiest person walking into the hall has a different effect, whereas, in the normal distribution, the average does not change much with such an extreme event of the tallest person walking in. Whereas in the power-law distribution, the average radically changes and cannot be easily predicted by adding just one wealthy person.
As a result, no matter how far we increase the number of samples in a power-law distribution, the values will not converge to an average. Imaging an average is like imagining how long a string is, for example.
Empirical data published by Clauset, Shalizi, and Newman shows how power-law distributions occur in dozens of real-world examples, including the distribution of wealth, words, wars, the internet, the evolution of species, book sales, cities, religions, etc.
Power laws have no scale and are said to be scale-free or self-similar, which is why they’re associated with fractal geometry, and only power laws are scale-free, as we’ll see next.
A distinctive feature of power-law curves is that when plotted on a scattered log-log plot, the graph looks like a downward sloping curve, almost like a straight line.

What are Fractals?
A fractal is a shape made out of parts that are similar to the whole in some way. Think of a fractal as an object that is “self-similar” or “scalable.” A fractal is made out of both smaller and larger copies of itself. Classic examples of fractals found in nature include coastlines, trees, snowflakes, etc.
Several German and French mathematicians introduced Fractals over a century ago, including Felix Hausdorff, Paul Levy, Pierre Fatou, Waclaw Sierpinski, and Gaston Julia.
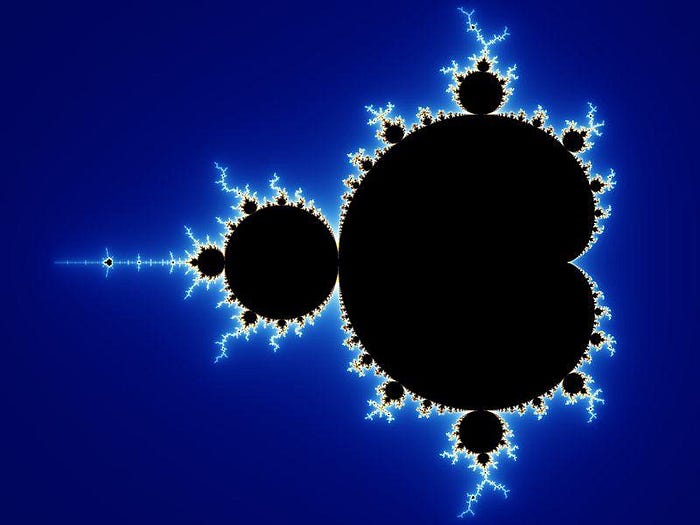
Then, in 1975, a mathematician named Benoit Mandelbrot introduced fractal geometry.

Classic examples of fractals are found in nature, coastlines, trees, snowflakes, etc.


Mandelbrot demonstrated how a simple formula with a feedback loop could lead to a complex system.

Self-similarity means that an object is made up of smaller copies of itself or looks the same at different scales. Moreover, the self-similarity continues across many scales. The main idea is that it repeats like a big shape made up of little shapes. That little shape is made up of little shapes of little shapes, etc.
Mathematically, strictly speaking for fractals, this kind of behavior continues forever as you zoom in on a shape. The Koch curve is an example; as you keep zooming in, you’d keep seeing that same shape repeated over and over again.

Fractal objects that are self-similar are said to be scale-free. They don’t have a sense of length or a typical scale or size associated with them. Geometrically speaking, it’s counter-intuitive because, in everyday life, we’re used to a scale or size of objects we encounter.
Let me illustrate the concept with two different vegetables from nature. The first is zucchini, and the second is a Romanesco, a type of cauliflower.
A zucchini has a particular size, and you may have some that are larger or smaller than the one in the picture. You cannot imagine giant zucchinis heavier than, say, 10 lbs. There are smaller zucchinis or baby zucchinis, and these are about the smallest you can find. So there’s a typical size associated with zucchinis, there’s an average, and then there are smaller and larger zucchinis. We don’t have microscopic tomatoes. That’s why zucchinis are said to have a scale. If you statistically sample zucchinis, you’ll get a bell-shaped curve in terms of the size.

One final way to look at it is that if I snapped a picture of a zucchini, you can picture that size in your head.
In contrast, let’s look at a picture of a Romanesco vegetable. If I were to show you the image below of the vegetable, would you be able to figure out its scale? You’ll notice that it’s much harder to see the scale of the Romanesco if you zoom in and out because it doesn’t have a characteristic size. What’s the typical size of spiral-looking shapes in a Romanesco vegetable? Well, they’re spirals of all different sizes. That’s sort of the point; as you’ve seen, as we zoom in more and more, we keep seeing more and more spirals and more Romanescos. And mathematically, that would go on forever. Compare that to the zucchini vegetable, and it’s a whole different situation. The zucchinis come in a pretty narrow range of sizes, whether you zoom in on them or not, and you’d be able to relate the scale of the zucchini from its picture. So, while you may be off by a little, you can get pretty close.


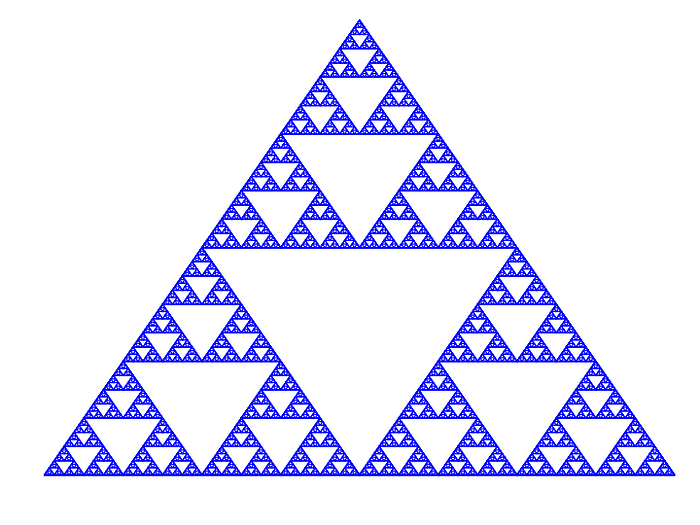
But imagine living inside a fractal world of the Sierpinski triangle and not our world. So this world consists of triangles and triangles double in size; you get three times as many triangles, so triangles within triangles within triangles. You wouldn’t be able to tell; there is no sense of scale here. It is not typical with zucchinis. It’s just the world of scale-free triangles.
Mathematical vs. Real-Life Fractals
Mathematically speaking, a fractal is a self-similar object across all scales. If you keep zooming in forever, you continue to see the same shape.
A real-life fractal wouldn’t have this theoretical property that you can zoom in forever. Ultimately, as you keep zooming in, say on a snowflake, you’ll be looking at individual molecules. So there’s a cut-off point. That’s how real-life fractals are different from mathematical or theoretical fractals. That’s why real-life fractals are said to be fractal-like.
In general, the notion of a mathematical fractal is an abstraction. It’s an idea that only exists in the world of math but doesn’t really exist in the real physical world in which we live. Nonetheless, the important takeaway here is that the power-law distribution feature of mathematical fractals still carries across to real-life fractals.
Stock Markets Fractals and Power Laws
Benoit Mandelbrot, the inventor of modern fractals, was the first to show how markets exhibited Power Law characteristics due to fractal-like behavior. You can read all about it in his book The Misbehavior of Markets.
Applying the self-similarity principle of fractals to stock markets would mean individual stocks are also self-similar and exhibit power-law characteristics. Moreover, this concept can be taken down to companies, business units, organizations, etc., which were studied and shown in numerous papers.
Implications on Business
By some amazing feature of the unity of science, these scaling laws seem to work across from fractal geometry to biology, geophysics, the spread of ideas, the distribution of wealth, and artistic success.
This is no different in business—the fractal property of the stock market, individual stocks, and many business dimensions.
This is no small finding of the decisions that many business leaders make, e.g., six sigma, statistics, heuristics, etc., are based on normal distribution assumptions because our minds cannot grasp the scale-free concept of power laws.
As such, business leaders need to be aware of when a situation falls under normal vs. power-law distribution to distinguish between garbage analysis and good analysis.
If you enjoyed reading about what you can learn from fractals, check out my other article on the subject:
How to Validate if Your Startup, New Business or Venture Will Succeed Using Fractals
While we’re on the subject, here’s what you can also apply from mother nature to your business:
How to Adopt Darwin’s Theory of Natural Selection to Gain Competitive Advantage
3 Rules from Nature’s Complex Systems for Better Business Performance
References:
Andriani, P., & McKelvey, B. (2006, July 1). Beyond Gaussian Averages: Redirecting Management Research Toward Extreme Events and Power Laws. Papers.ssrn.com. https://papers.ssrn.com/sol3/papers.cfm?abstract_id=983084
Clauset, A., Shalizi, C. R., & Newman, M. E. J. (2009). Power-Law Distributions in Empirical Data∗. SIAM Review. https://pdodds.w3.uvm.edu/research/papers/others/2009/clauset2009b.pdf
Warusawitharana, M. (2016). Time-varying Volatility and the Power Law Distribution of Stock Returns. Www.federalreserve.gov. https://www.federalreserve.gov/econres/feds/time-varying-volatility-and-the-power-law-distribution-of-stock-returns.htm